Table of Contents
ChartWatch ASX Scans Celebrates First Birthday
🎉 This week marks the first anniversary of ChartWatch ASX Scans! To celebrate, we’ve revisited significant insights from the past year, including notable successful trades and less favourable outcomes.
Today, we delve into one of the key setups in ChartWatch, known as the turnaround setup. Yesterday, we explored the continuation setup, so let’s focus on how to identify turnaround patterns in trading.
Understanding the Turnaround Setup
The turnaround setup indicates a major trend shift—momentarily transitioning from a prolonged downtrend to an uptrend or vice versa. The change is often so new that the long-term trend indicator may still show a neutral position. Here are the rules for identifying a long turnaround setup, which suggests buying a stock:
Long Setup Criteria:
- The long-term trend ribbon must be neutral (amber) or up (dark green) and cannot be downward (dark pink).
- The short-term trend ribbon must be upward (light green).
- The price action shows rising peaks and troughs.
- The price closes above the long-term trend ribbon and sets troughs at or above this level.
- There is a predominance of demand-side candles (candles with white bodies and/or downward shadows).
- A strong demand-side candle is evident.
Case Study: Megaport (ASX: MP1)
Megaport serves as an excellent example, displaying several long turnaround setups. Each green arrow on this chart aligns with a Feature Uptrend, indicative of my highest conviction uptrends.
Notably, this chart also illustrates short turnaround setups denoted by red arrows, signifying Feature Downtrends—my highest conviction downtrends.
Short Setup Criteria:
For a short turnaround setup, traders seek prices transitioning from neutral or upward trends into a downtrend:
- The long-term trend ribbon must be neutral (amber) or down (dark pink), and cannot be up (dark green).
- The short-term trend ribbon must show downward (light pink).
- Price action should portray falling peaks and troughs.
- The price closes below the long-term trend ribbon and establishes peaks within or below it.
- There is a predominance of supply-side candles (candles with black bodies and/or upward shadows).
- A pronounced supply-side candle is present.
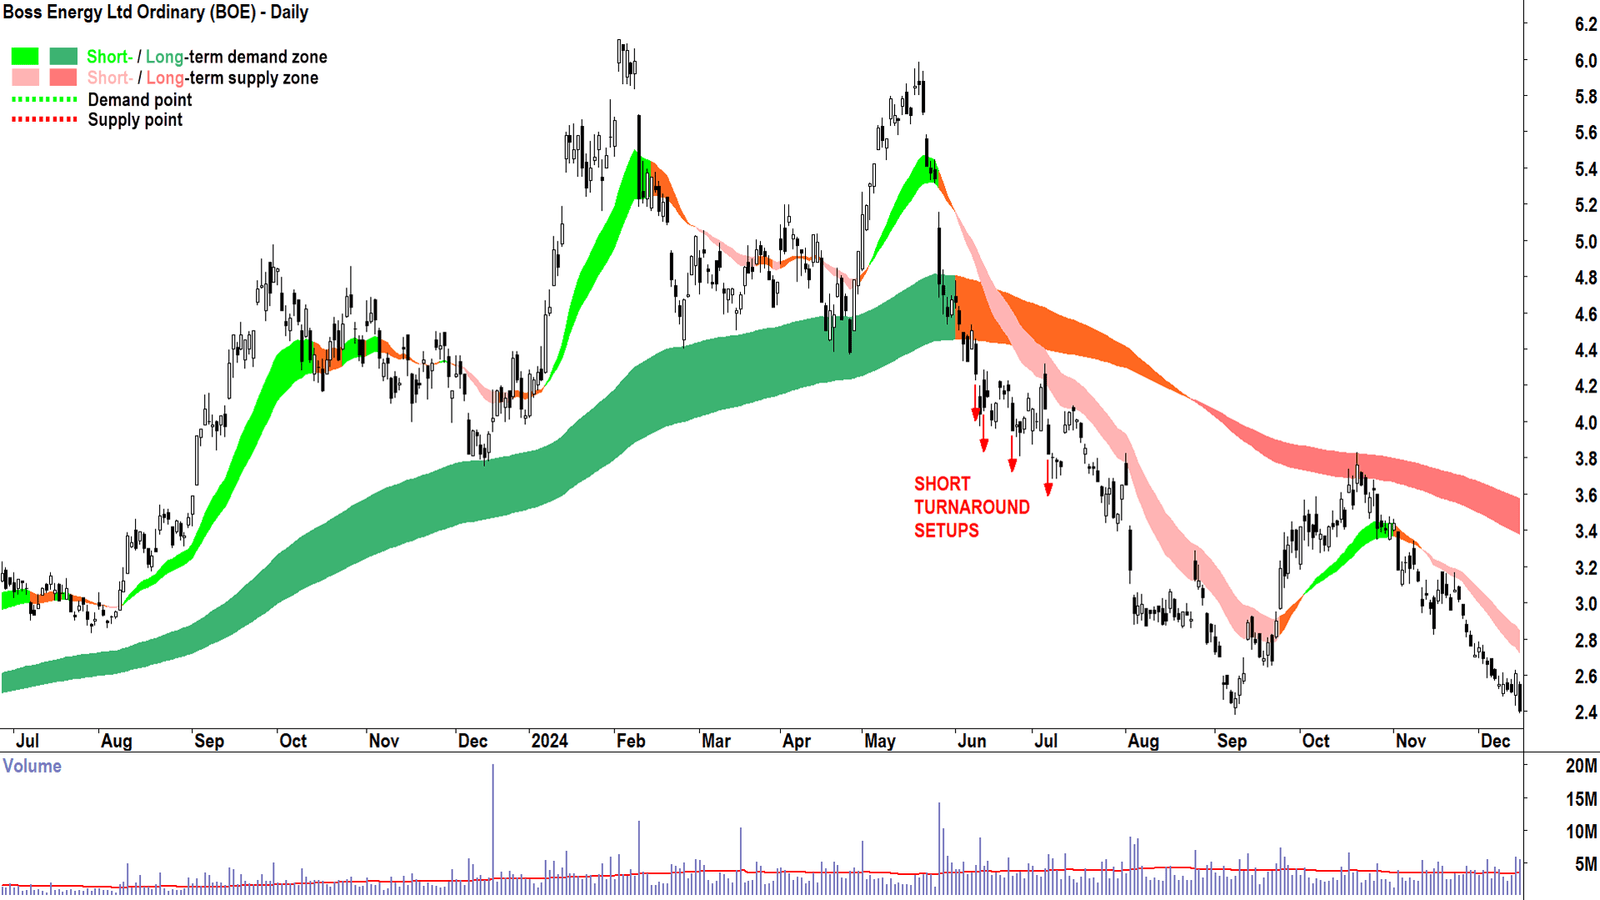
Case Study: Boss Energy (ASX: BOE)
Referencing Boss Energy, we observe multiple short turnaround setups, with red arrows correlating to Feature Downtrends in the analysis.

ChartWatch Daily ASX Scans
In each ChartWatch Daily ASX Scans posting, I curate lists based on my trend-following technical analysis approach aimed at signalling the best performing uptrends and downtrends on the ASX.
Investors may choose to engage with stocks that exhibit strong uptrends while avoiding or short-selling those in robust downtrends. You can use AI to convert the lists below into formats compatible with trading platforms like TradingView for more accessible analysis.
Current Uptrends Scan List
| Company | Code | Last Price | 1mo % | 1yr % |
|---|---|---|---|---|
| Life360 | 360 | $33.37 | +52.1% | +121.9% |
| African Gold | A1G | $0.165 | +32.0% | +396.4% |
| Astral Resources | AAR | $0.175 | +9.4% | +116.0% |
| Bravura Solutions | BVS | $2.48 | +13.2% | +126.8% |
| Catapult Group International | CAT | $5.26 | +28.6% | +235.0% |
| … | … | … | … | … |
| Technology One | TNE | $40.77 | +35.6% | +128.9% |
| Xero | XRO | $185.75 | +13.1% | +38.5% |
Downtrodden Stocks Scan List
| Company | Code | Last Price | 1mo % | 1yr % |
|---|---|---|---|---|
| Australian Clinical Labs | ACL | $2.92 | -6.4% | +32.1% |
| Champion Iron | CIA | $4.27 | -6.6% | -42.0% |
| Collins Foods | CKF | $7.87 | -4.5% | -17.0% |
| Coronado Global Resources | CRN | $0.125 | -35.9% | -88.8% |
| … | … | … | … | … |
| Vulcan Steel | VSL | $6.41 | -13.0% | -11.1% |
| Vulcan Energy Resources | VUL | $4.00 | -17.5% | -27.8% |
Conclusion
As ChartWatch continues to evolve, it remains focused on identifying potential trading opportunities while encouraging diligent research by its users. Happy investing!

