Table of Contents
As May approaches, investors are often faced with the enduring dilemma: is it time to sell and return in October to capitalise on potential gains during the seasonally favourable ‘Santa rally’? The advice to "sell in May" is supported by historical trends, indicating that the S&P/ASX 200, along with many international indices, typically sees weaker performance from May through October when compared to other six-month intervals.
Assessing the Seasonality of Markets
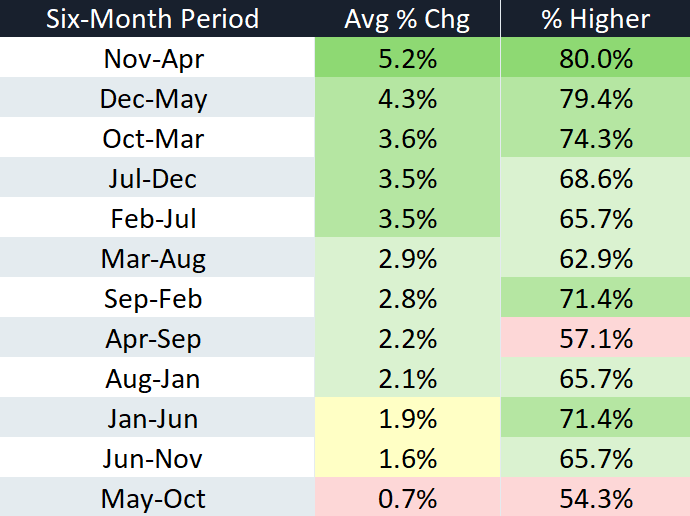
Data reveals that from 1990 onwards, the S&P/ASX 200 has shown an average increase of only 0.7% during the May-to-October period, with gains occurring just 54% of the time. Furthermore, this timeframe ranks low in performance when considering total returns, making it a challenging season for investors.
Source: Market Index (1990 – current)
During this period, the ASX has historically ranked second-to-last among all six-month stretches, indicative of its lower likelihood to yield positive returns.
Examining May in Detail
Examining the month of May specifically reveals its notorious reputation for volatility. Over the past decade, the ASX 200 has struggled during this month, which statistically ranks as the second worst for Australian equities, averaging a decline of 0.39%.

Source: Market Index
A Notable Turnaround
Despite this historical weakness, the S&P/ASX 200 is entering May 2025 with remarkable momentum. The index experienced a 3.6% increase in April, bouncing back from an intra-month decline of 8.6%. This impressive recovery signifies a monthly turnaround of 13.3%, marking the seventh-largest bounce since 2000.
Such significant recoveries are uncommon and usually occur under extraordinary market conditions, like those witnessed during the Global Financial Crisis or the COVID-19 pandemic. In many cases, dramatic reversals historically correlate with positive returns in subsequent months, spanning one, three, six, and twelve months. However, the reversal in 2007 serves as a cautionary tale, leading up to the market crash associated with the Global Financial Crisis.

Source: Market Index
Navigating Volatility Ahead
Historical data implies that while the near future may be volatile, with average returns of 1.9% over a month and positive outcomes occurring only 66% of the time, the aftermath of such volatility often leaves the market in a precarious state. Thus, while the May-to-October timeframe has been traditionally weak, it has still produced positive returns on average.
Consequently, rather than defaulting to a sell strategy purely based on the calendar, investors might consider analysing broader market trends and current conditions. The prospect of the market improving following significant recoveries suggests that selling indiscriminately could be ill-advised. A nuanced approach, taking into account both historical data and current momentum, appears to provide the most prudent investment strategy.
In conclusion, while historical patterns suggest caution during this period, investors are encouraged to exercise discernment and make decisions based on comprehensive market analysis rather than fear of seasonal trends alone.