Table of Contents
ASX 200 Sees V-Shaped Recovery: Understanding the Trends
The S&P/ASX 200 index has demonstrated an impressive V-shaped recovery, climbing 2.8% beyond its pre-Liberation Day close on 2 April and soaring 14% from its lows on 14 April. This surge was largely propelled by a substantial rally between 22 April and 2 May, during which the index rose by 5.4%. Given this substantial rebound, it’s vital to explore the frequency of such extended winning streaks and the subsequent performance of the market.
An Examination of Winning Streaks
Since 2000, the ASX 200 has recorded 40 instances where winning streaks have lasted for seven days or more, yielding an average return of 3.52%. The longest of these streaks was a remarkable 12-day run in February 2015, during which the index increased by 9.66%. Contributing factors to this prolonged rally included global monetary easing, exemplified by the Reserve Bank of Australia reducing interest rates to a record low of 2.25%, stabilising commodity prices, and strong corporate earnings.
In contrast to data associated with market volatility and downturns, which often cluster around significant events like the Global Financial Crisis or the recent pandemic, these winning streaks appear to be fairly widespread across various market conditions.
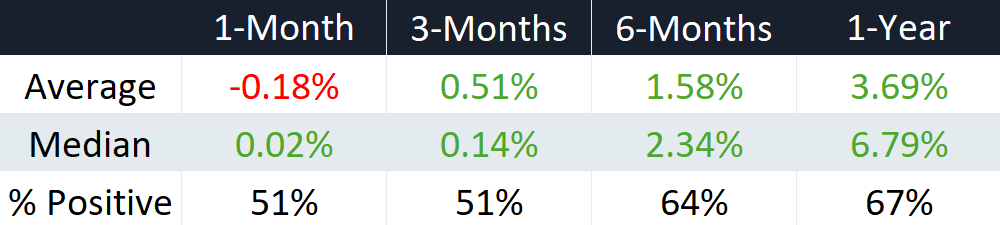
Performance Summary for the ASX 200’s 40 instances of winning streaks.
Predicting Post-Streak Performance
The performance of the ASX post-winning streak is less straightforward. On average, one month following these extended rallies, returns see a slight decline of 0.18%, while three-month returns inch up by 0.51%. Both of these timeframes exhibit positive returns only 51% of the time, hinting at potential volatility and uncertainty in the immediate aftermath of a rally.
The combination of a minor one-month dip, followed by a modest three-month gain and limited consistency, indicates that extended winning streaks often coincide with a peak in short-term momentum. Investors might then experience periods of consolidation or volatility as the market adjusts to the swift gains.
However, looking further ahead, returns tend to improve over six and twelve months, averaging increases of 1.58% and 3.69%, respectively. This signals that supportive market conditions, driven by factors such as earnings growth, stable commodity pricing, and ongoing monetary easing, are typically in play. Despite this, the positive outcomes during these periods are observed only 64% and 67% of the time.
Conclusion: Caution Ahead
Historical analysis indicates that such extended winning streaks, though relatively common, often signal a short-term peak in market momentum. Currently, only 52% of the constituents within the All Ordinaries are above their 200-day moving averages, indicating a lack of broad participation in the rally. Enhanced volatility and mixed performances across various sectors further imply that the strength of this rally could be misleading.
Investors are advised to proceed cautiously in this post-rally environment, particularly with global uncertainties looming, such as potential political developments that could influence market stability. The possibility of sudden sell-offs or rallies due to unexpected headlines makes it crucial for investors to remain vigilant and manage risk carefully in the current landscape.