Table of Contents
ASX 200 Rally: Insights into Recent Market Performance
The S&P/ASX 200 index has seen a remarkable turnaround since it hit a low on April 7, just days following President Trump’s controversial ‘Liberation Day’ announcement. Over the past 26 trading sessions, the index has demonstrated extraordinary upward momentum, marked by several significant trends:
- A notable 14.1% increase since April 7, placing it 5% above levels recorded before the ‘Liberation Day’ announcement.
- Out of the 26 trading sessions, the index has risen in 20, accounting for a 77% win rate.
- A striking single-day rally of 4.5% on April 10, the largest since the onset of the pandemic.
- A consecutive seven-day period of gains from April 22 to May 5, reflecting a total increase of 5.4%.
- An ongoing winning streak of eight days from May 7 to May 16, resulting in an additional 2.5% gain.
Historical Context: Seven-Day vs. Eight-Day Streaks
Since 2000, the ASX 200 has experienced 40 streaks of seven days or more, yielding an average gain of 3.52%. For those exceeding eight days, there have been 16 occurrences, presenting a slightly larger average gain of 4.06%. Recent analyses have indicated that these winning streaks are evenly distributed, not clustered around significant market events like the Global Financial Crisis or the COVID-19 pandemic.
However, historical trends indicate such streaks might signal a near-term peak, leading to decreased returns in one- and three-month periods as the market absorbs rapid gains.
Following the recent seven-day rally ending on May 5, the ASX 200 surged an additional 1.5% by May 16, outperforming the typical historical averages. This reinforces the notion that past performance does not always serve as a reliable indicator for future returns.
Analyzing Eight-Day Streaks
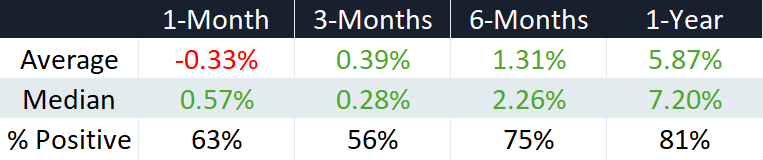
When examining eight-day or longer streaks, the data reveals similar fluctuations in near-term returns. However, a higher percentage of positive results in one- and three-month forward returns compared to the seven-day streaks has been observed. Notably, the returns after one year following an eight-day streak average 5.87%, markedly better than the 3.69% for seven-day streaks, with an 81% positive outcome rate compared to 67%.
Conclusion
The historical data suggests that major winning streaks can propel the ASX 200 into overbought territory, resulting in volatile short-term performance as momentum wanes. That said, returns 12 months after an eight-day streak are particularly strong, though the limited examples (16 instances) could affect these results.
The ongoing rally, marked by a 1.5% increase short of two weeks post the notable seven-day streak, is an unusual occurrence. Of the 40 such streaks recorded since the year 2000, only 7 (17.5%) witnessed one-month forward returns at or exceeding 1.5%. These instances have typically coincided with recovery phases following significant market disruptions such as the dot-com bubble in 2000, the Global Financial Crisis in 2009, the COVID-19 pandemic in 2020, and the yen carry trade collapse in August 2024, which may suggest that times of adversity can precede robust long-term market recoveries.
Overall, while the current market dynamics warrant cautious optimism, investors should remain aware of historical trends that may influence their short-term strategies and long-term expectations.